Bostonography
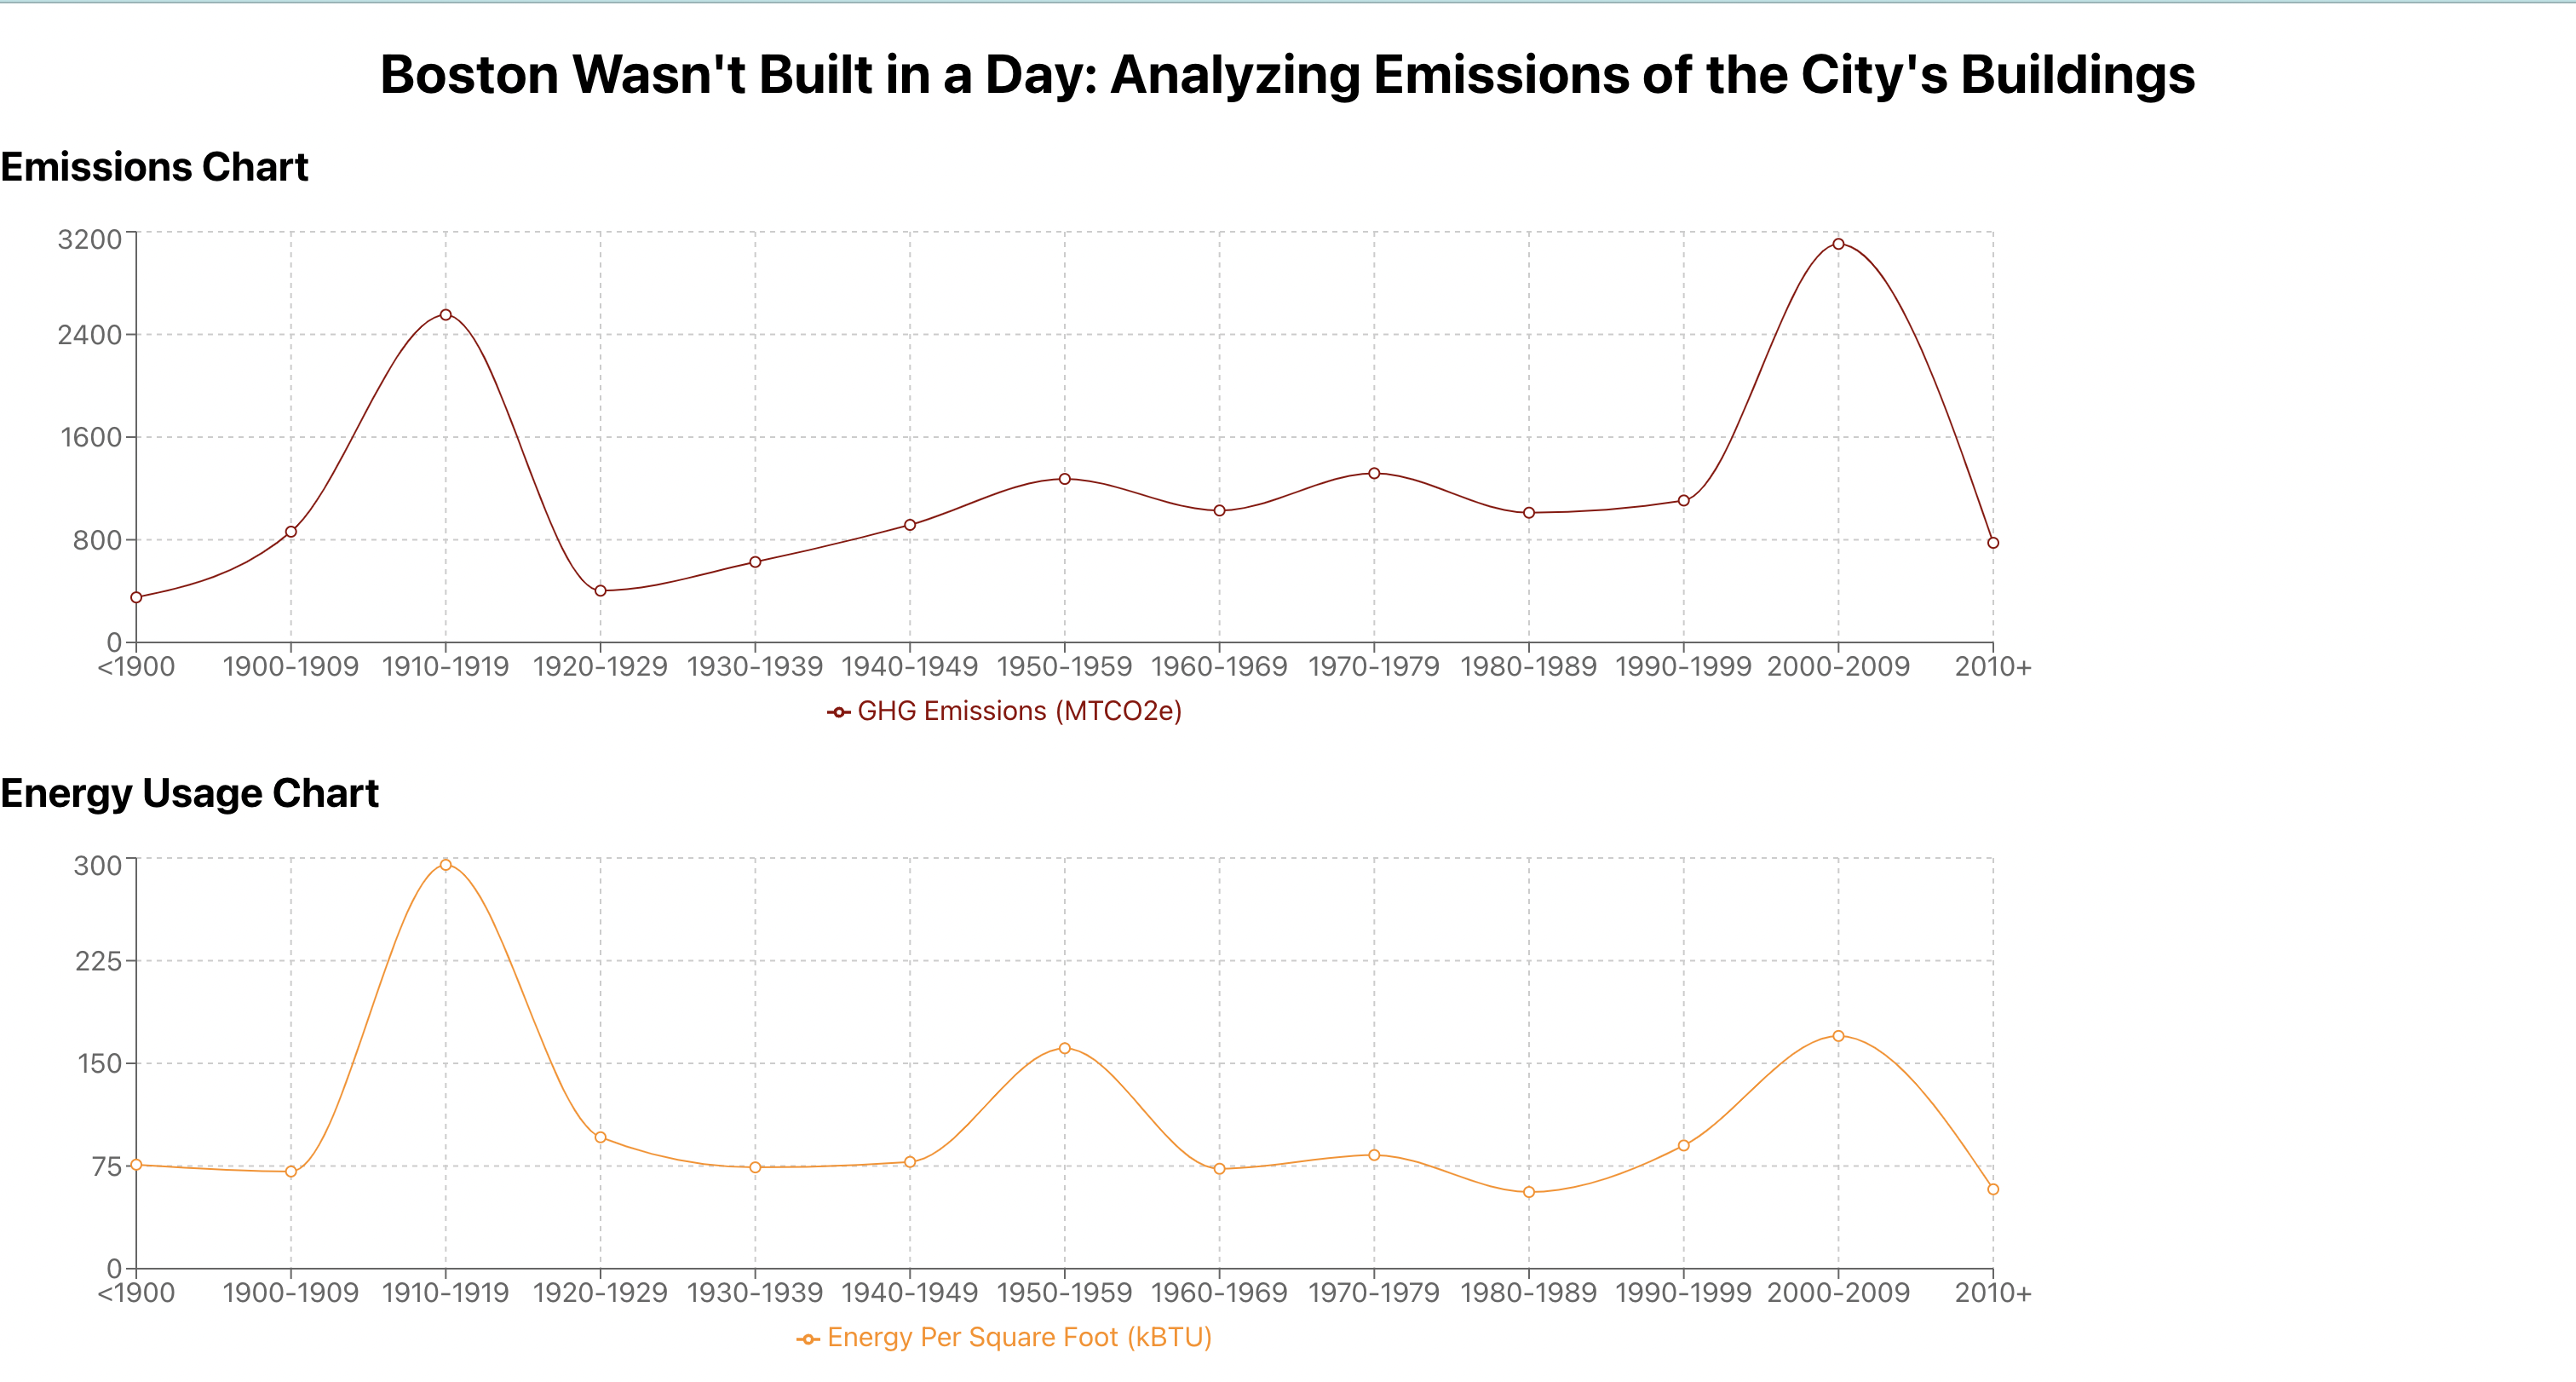
JavaScriptReact.jsThis project was for my Bostonography class, which explored Boston through various datasets. I chose to examine data related to energy and emissions data from 2021. The site below shows the graphs I made using React, as well as an analysis of what conclusions can be drawn from the data.